

There’s a wide variance of life expectancies among the 50 states in the U.S., according to a recent report prepared by Assurance, an insurance technology platform that helps consumers with decisions related to insurance and financial well-being. Assurance scoured life expectancy data prepared in January 2023 by the U.S. Centers for Disease Control and Prevention (CDC). With this data, Assurance created several easy-to-understand graphics that offer information about life expectancies.
Figure 1 below shows the 10 states with the highest life expectancy, starting with the one with the highest life expectancy.
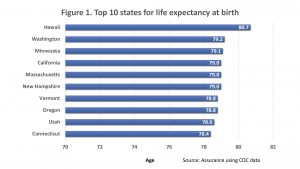
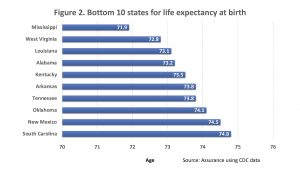
Figure 2 below shows the 10 states with the lowest life expectancy, starting with the one with the lowest life expectancy.
Life expectancies are a basic measure of well-being
As measured by the CDC, life expectancies are a basic measurement of well-being in a broad population and not a prediction of how long an individual might live. The CDC measures the expected lifespan for a person born in the year of measurement. This measurement is calculated based on the assumption that the individual will live and die according to the rates of death that are prevalent in the measurement year for each age. There’s no assumed improvement or backsliding in the assumed mortality rates in future years for each age in the life expectancy calculation.
By contrast, an estimated lifespan for an individual would consider their current age, their gender, and some basic lifestyle information. It might also attempt to project future improvements or backsliding in mortality rates based on key factors.
Significant influences on life expectancy calculations
Leading causes of death in the U.S. are heart disease, cancer, and accidents in that order. These immediate causes are significantly influenced by factors in the population such as poverty rates, educational attainment, rates of obesity and smoking, access to healthcare, prevalence of violent crime, and the support people receive from federal, state, and local governments. All these factors can vary widely among different states, which can be a key reason why life expectancies vary by state.
When you think about it, all these factors also have the potential to influence a person’s quality of life. The measured life expectancy rate rolls up all these factors into one objective measurement of well-being that’s based on population data.
In addition to the factors listed above, mortality rates increased and life expectancies decreased in the past few years due to the COVID pandemic. A recent article titled “Live Free And Die” summarized recent research results that show that life expectancies in most countries around the world rebounded after the COVID pandemic but that they continued to decline in the United States. Many of the reasons cited in the article for the continued decline in U.S. life expectancies are the same or similar to the factors listed above.
Why should retirees care about the life expectancies reported here if these measures don’t predict your own lifespan? Life expectancy calculations indicate the general well-being of the entire population in your area. While the living conditions in your area can influence your own lifespan and quality of life, retirees should focus on their remaining life expectancy given their age. They should also consider how the factors listed above that influence life expectancies in the population might apply to them.
You can obtain customized estimates of your remaining life expectancy at the Actuaries Longevity Illustrator. Part of your planning for retirement is understanding how long you as an individual might live, instead of relying on generalized information about larger populations you see in the media.